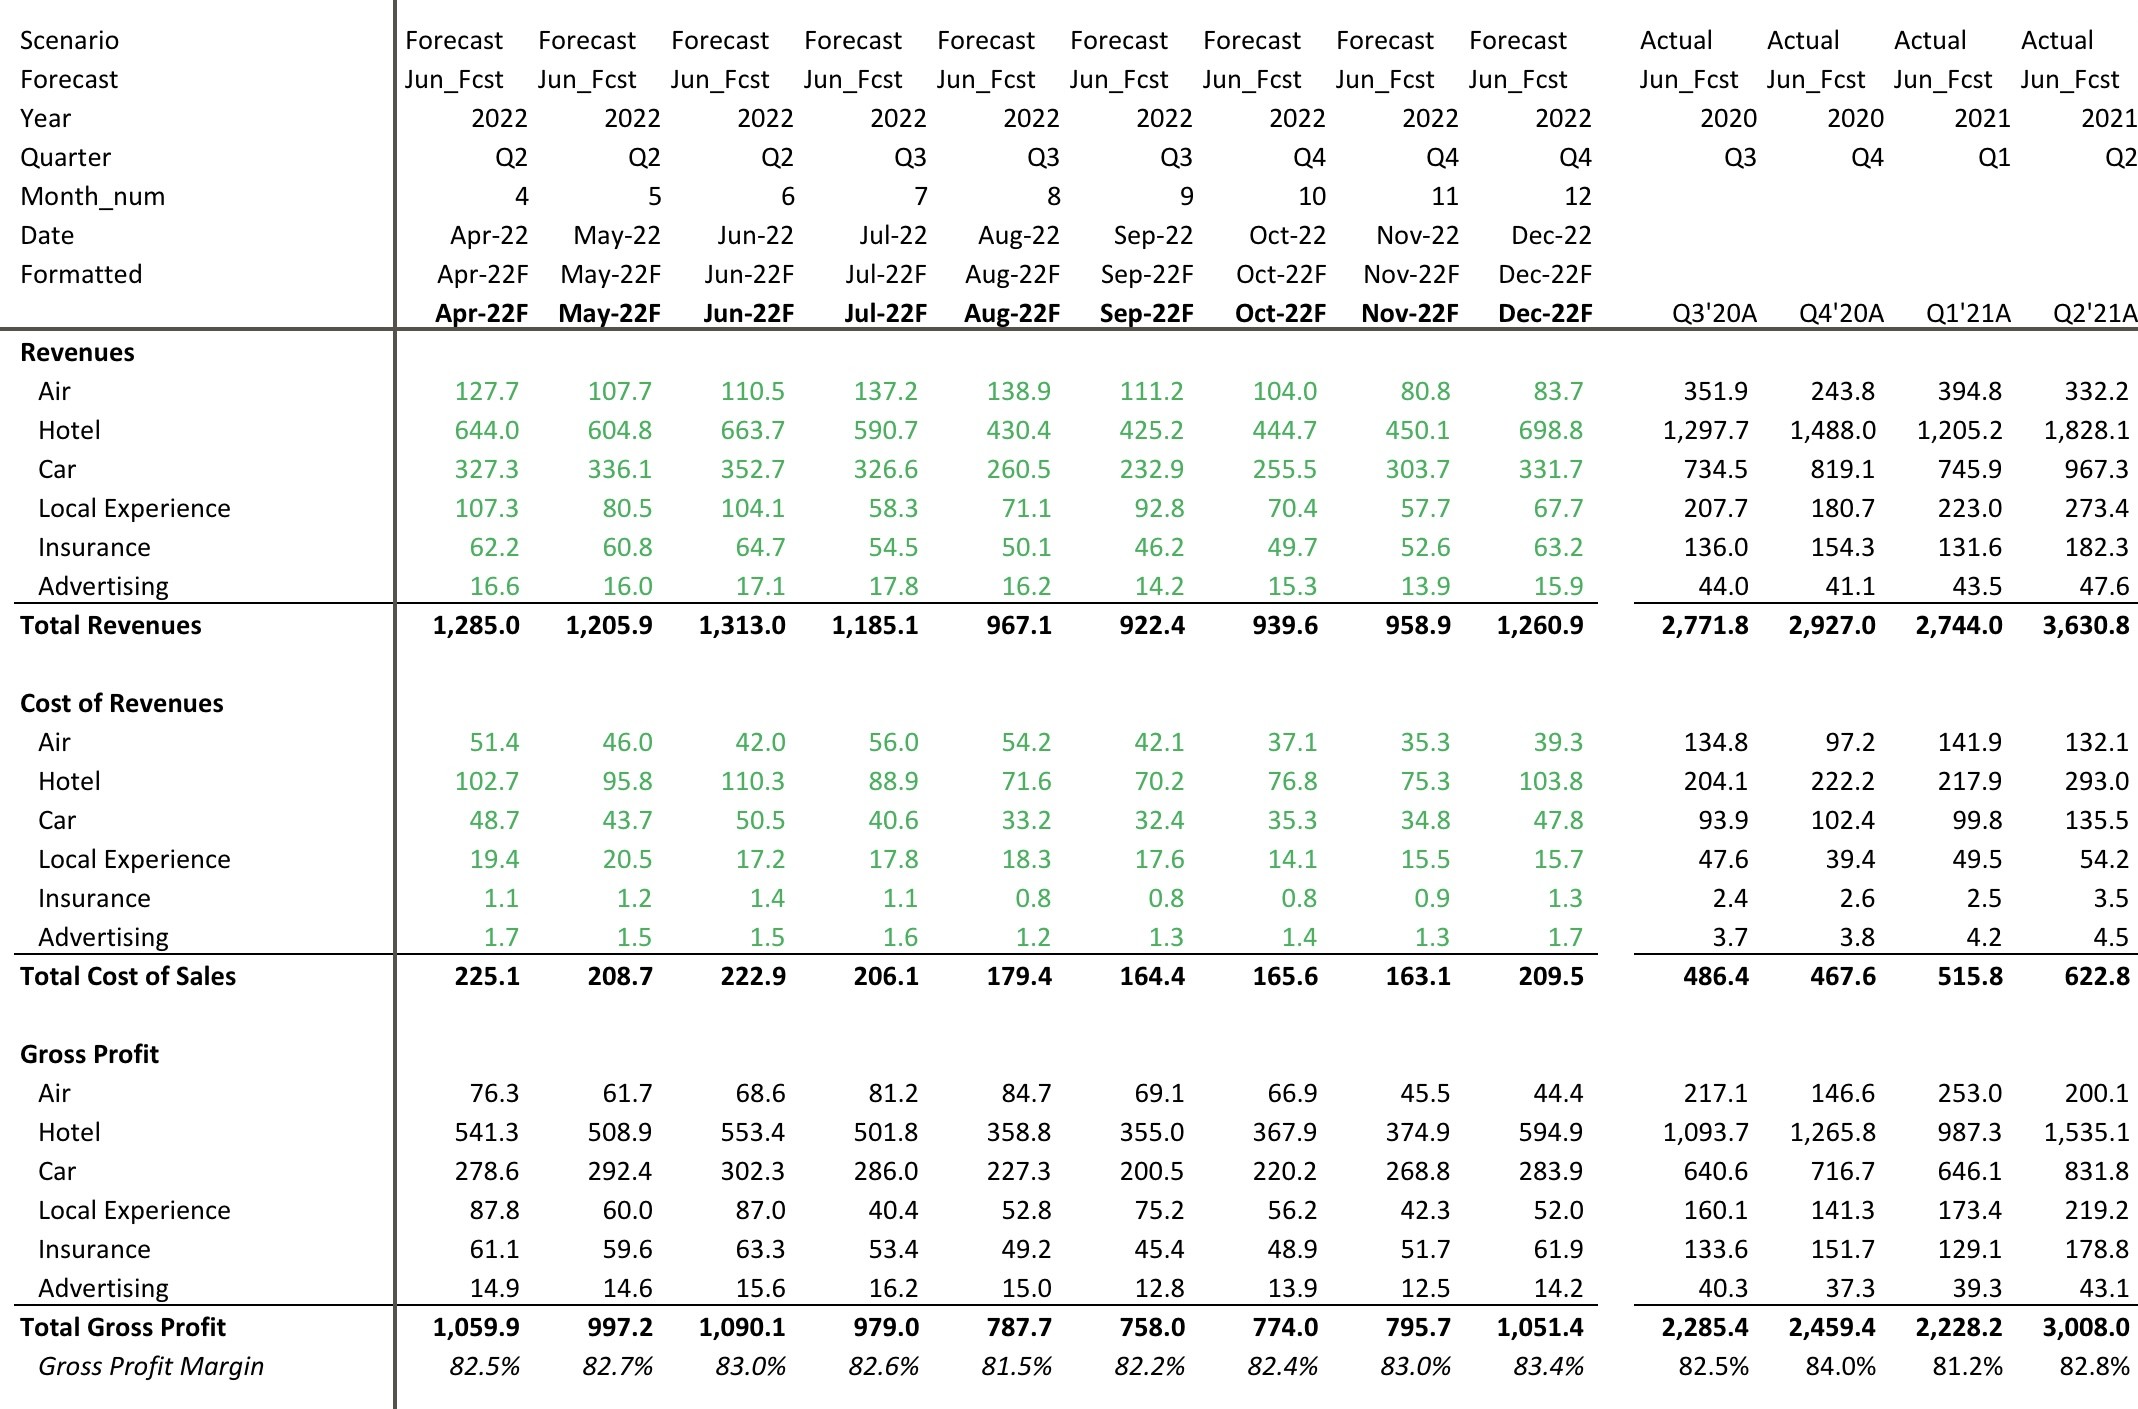
Built a driver-based FP&A operating model in Excel to support long-range planning, forecasting, and scenario analysis.
Linked income statement, balance sheet, and cash flow projections to evaluate revenue growth, expense structure, headcount planning, and cash flow dynamics.
Applied professional modeling standards, documentation, and error checks to ensure data accuracy, transparency, and confidence in financial reporting outputs.
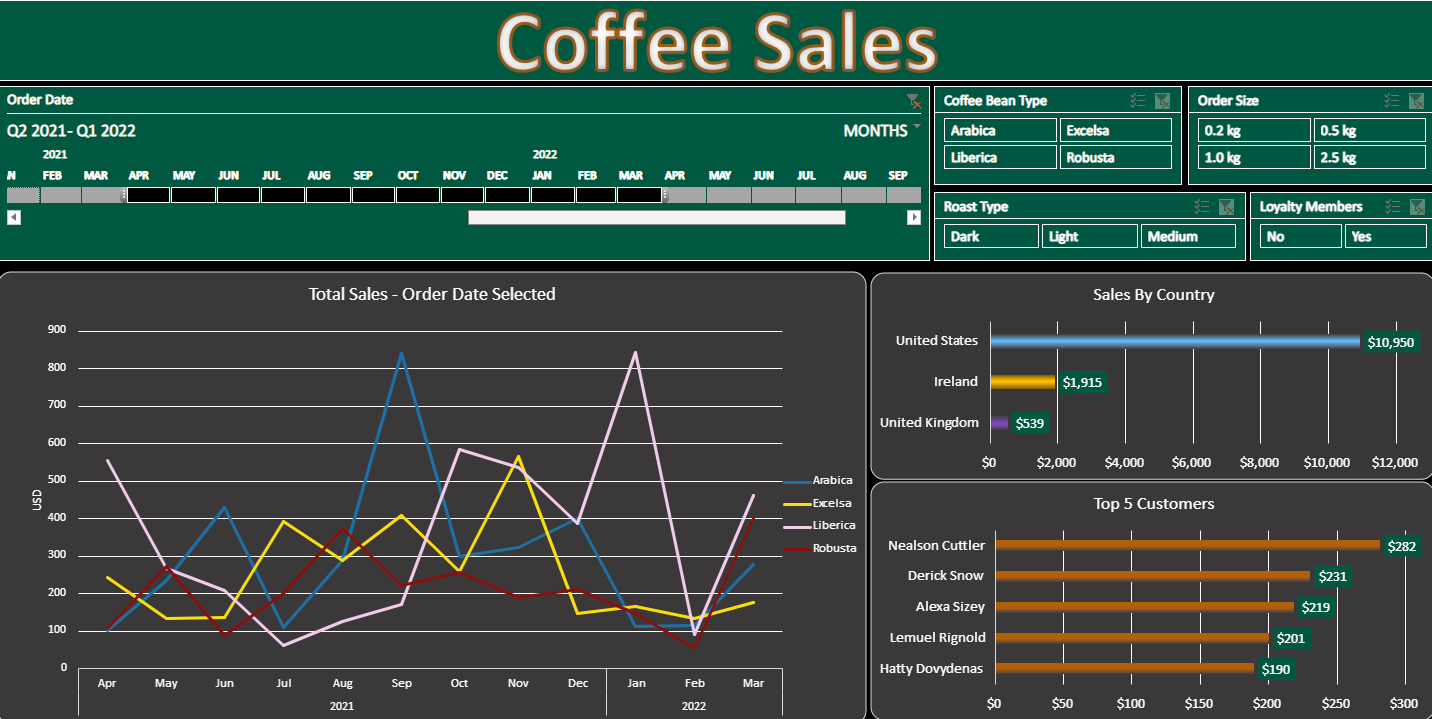
Built an interactive Excel dashboard to analyze coffee sales performance across revenue, customer segments, and product trends.
Designed KPI views to track sales growth, top customers, and product performance, supporting pricing, inventory planning, and management reporting.
Enabled data-driven decision-making by translating raw sales data into clear, actionable financial insights.
.png)
Developed an interactive Tableau dashboard to visualize global COVID-19 infections and deaths across countries and continents.
Designed clear, executive-style views to highlight geographic trends, case severity, and temporal patterns for comparative analysis.
Enabled data-driven interpretation by transforming cleaned, structured datasets into intuitive visual insights suitable for reporting and decision-making.

Performed structured data exploration and validation using SQL to analyze global COVID-19 infections and mortality trends.
Utilized joins, aggregations, and filtering to clean, organize, and verify large datasets prior to visualization and reporting.
Created a reliable analytical foundation to support downstream Tableau dashboards and ensure accuracy and consistency in reported insights.